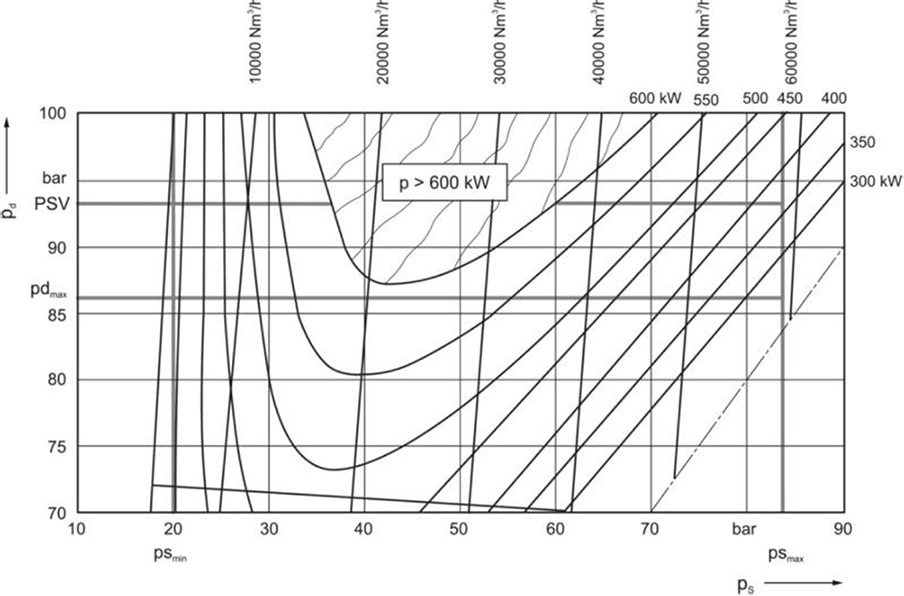
Characteristic diagrams show the volume flow and the required work input for variable working conditions. They can be obtained either by measurement or by approximation calculations. The curves can be given either with absolute values or with values related to working conditions of volume flow, discharge pressure and power requirement. Alternatively, characteristic values such as pressure ratio, volumetric efficiency and energy efficiency are being used.
As a first example, we look at a single-stage compressor with variations of suction and discharge pressures. For a natural gas compressor in boxer design the manufacturer supplies the diagram as shown (operating map), see Figure 6.1.
Figure 6.1: Operating map of a natural gas compressor [0]
This diagram shows the changes in volume flow and power requirement in relation to the suction and discharge pressure, also the limits to operating conditions. A characteristic feature is the maximum of power requirement at average compression ratios. (The diagram was calculated with the technical data of the compressor and the gas composition.)
The compression ratio of the first stage hardly changes. Therefore, the volumetric efficiency and volume flow of the compressor only changes to a very small degree. The increase of the compression ratio leads to smaller volumetric efficiencies in the higher stages. This is however compensated by the higher density of the gas in the suction duct of the respective stage.